



The quarterly RAJAR Infographic is here with all the data you need for Q4, 2019, including All Radio Listening, Average Hours Per Listener and Digital Platforms.
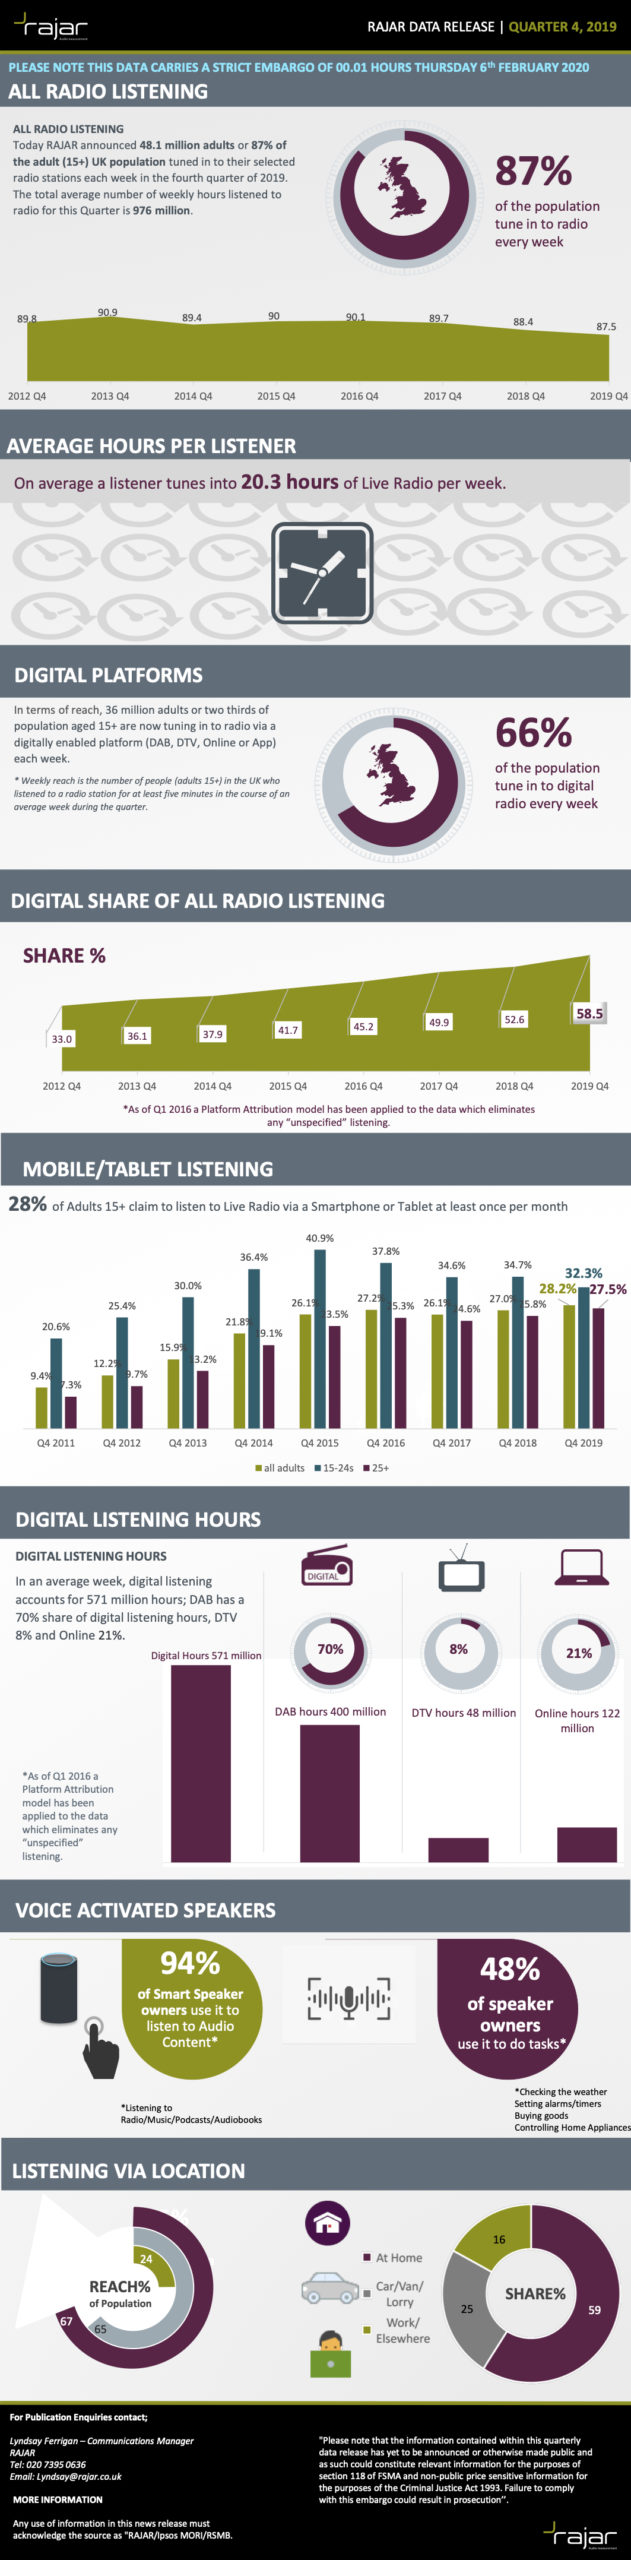

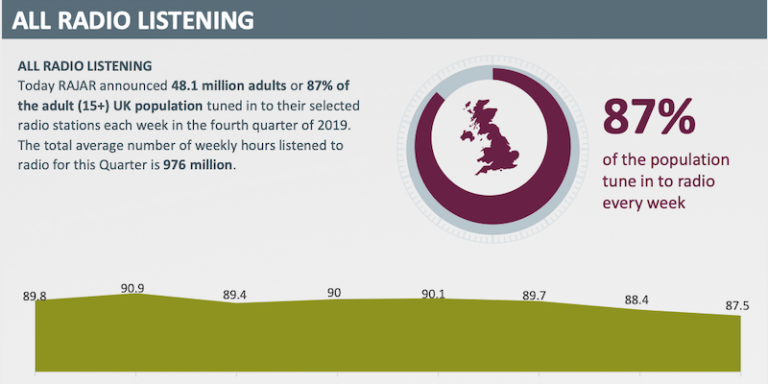
The quarterly RAJAR Infographic is here with all the data you need for Q4, 2019, including All Radio Listening, Average Hours Per Listener and Digital Platforms.






Sympathy for the Inrix Broadcasters.